El MACD es uno de esos indicadores que todo el mundo menciona pero pocos realmente entienden. He visto a principiantes agregar el MACD a sus gráficos, mirarlo durante semanas sin entender qué les está diciendo, y eventualmente dejarlo o seguirlo ciegamente sin contexto. Ninguno de esos enfoques funciona. Aquí está lo que el MACD realmente mide y cómo usarlo.
¿Qué Calcula Realmente el MACD?
MACD son las siglas de Convergencia/Divergencia de Medias Móviles (Moving Average Convergence Divergence). Mide la relación entre dos medias móviles exponenciales (EMA) del precio de una acción, típicamente la EMA de 12 períodos y la EMA de 26 períodos. La línea MACD en sí misma es simplemente la EMA de 12 períodos menos la EMA de 26 períodos.
Encima de eso, hay una «línea de señal» — una EMA de 9 períodos de la línea MACD. Y luego está el histograma — las barras que muestran la diferencia entre la línea MACD y la línea de señal.
Por Qué Estos Números
La EMA de 12 refleja el momentum a corto plazo. La EMA de 26 refleja el momentum a medio plazo. Cuando la diferencia entre ellas (la línea MACD) crece, el momentum a corto plazo está acelerando en relación con el momentum a medio plazo — una señal alcista. Cuando la diferencia se encoge o va negativa, el momentum a corto plazo se está debilitando — una señal bajista.
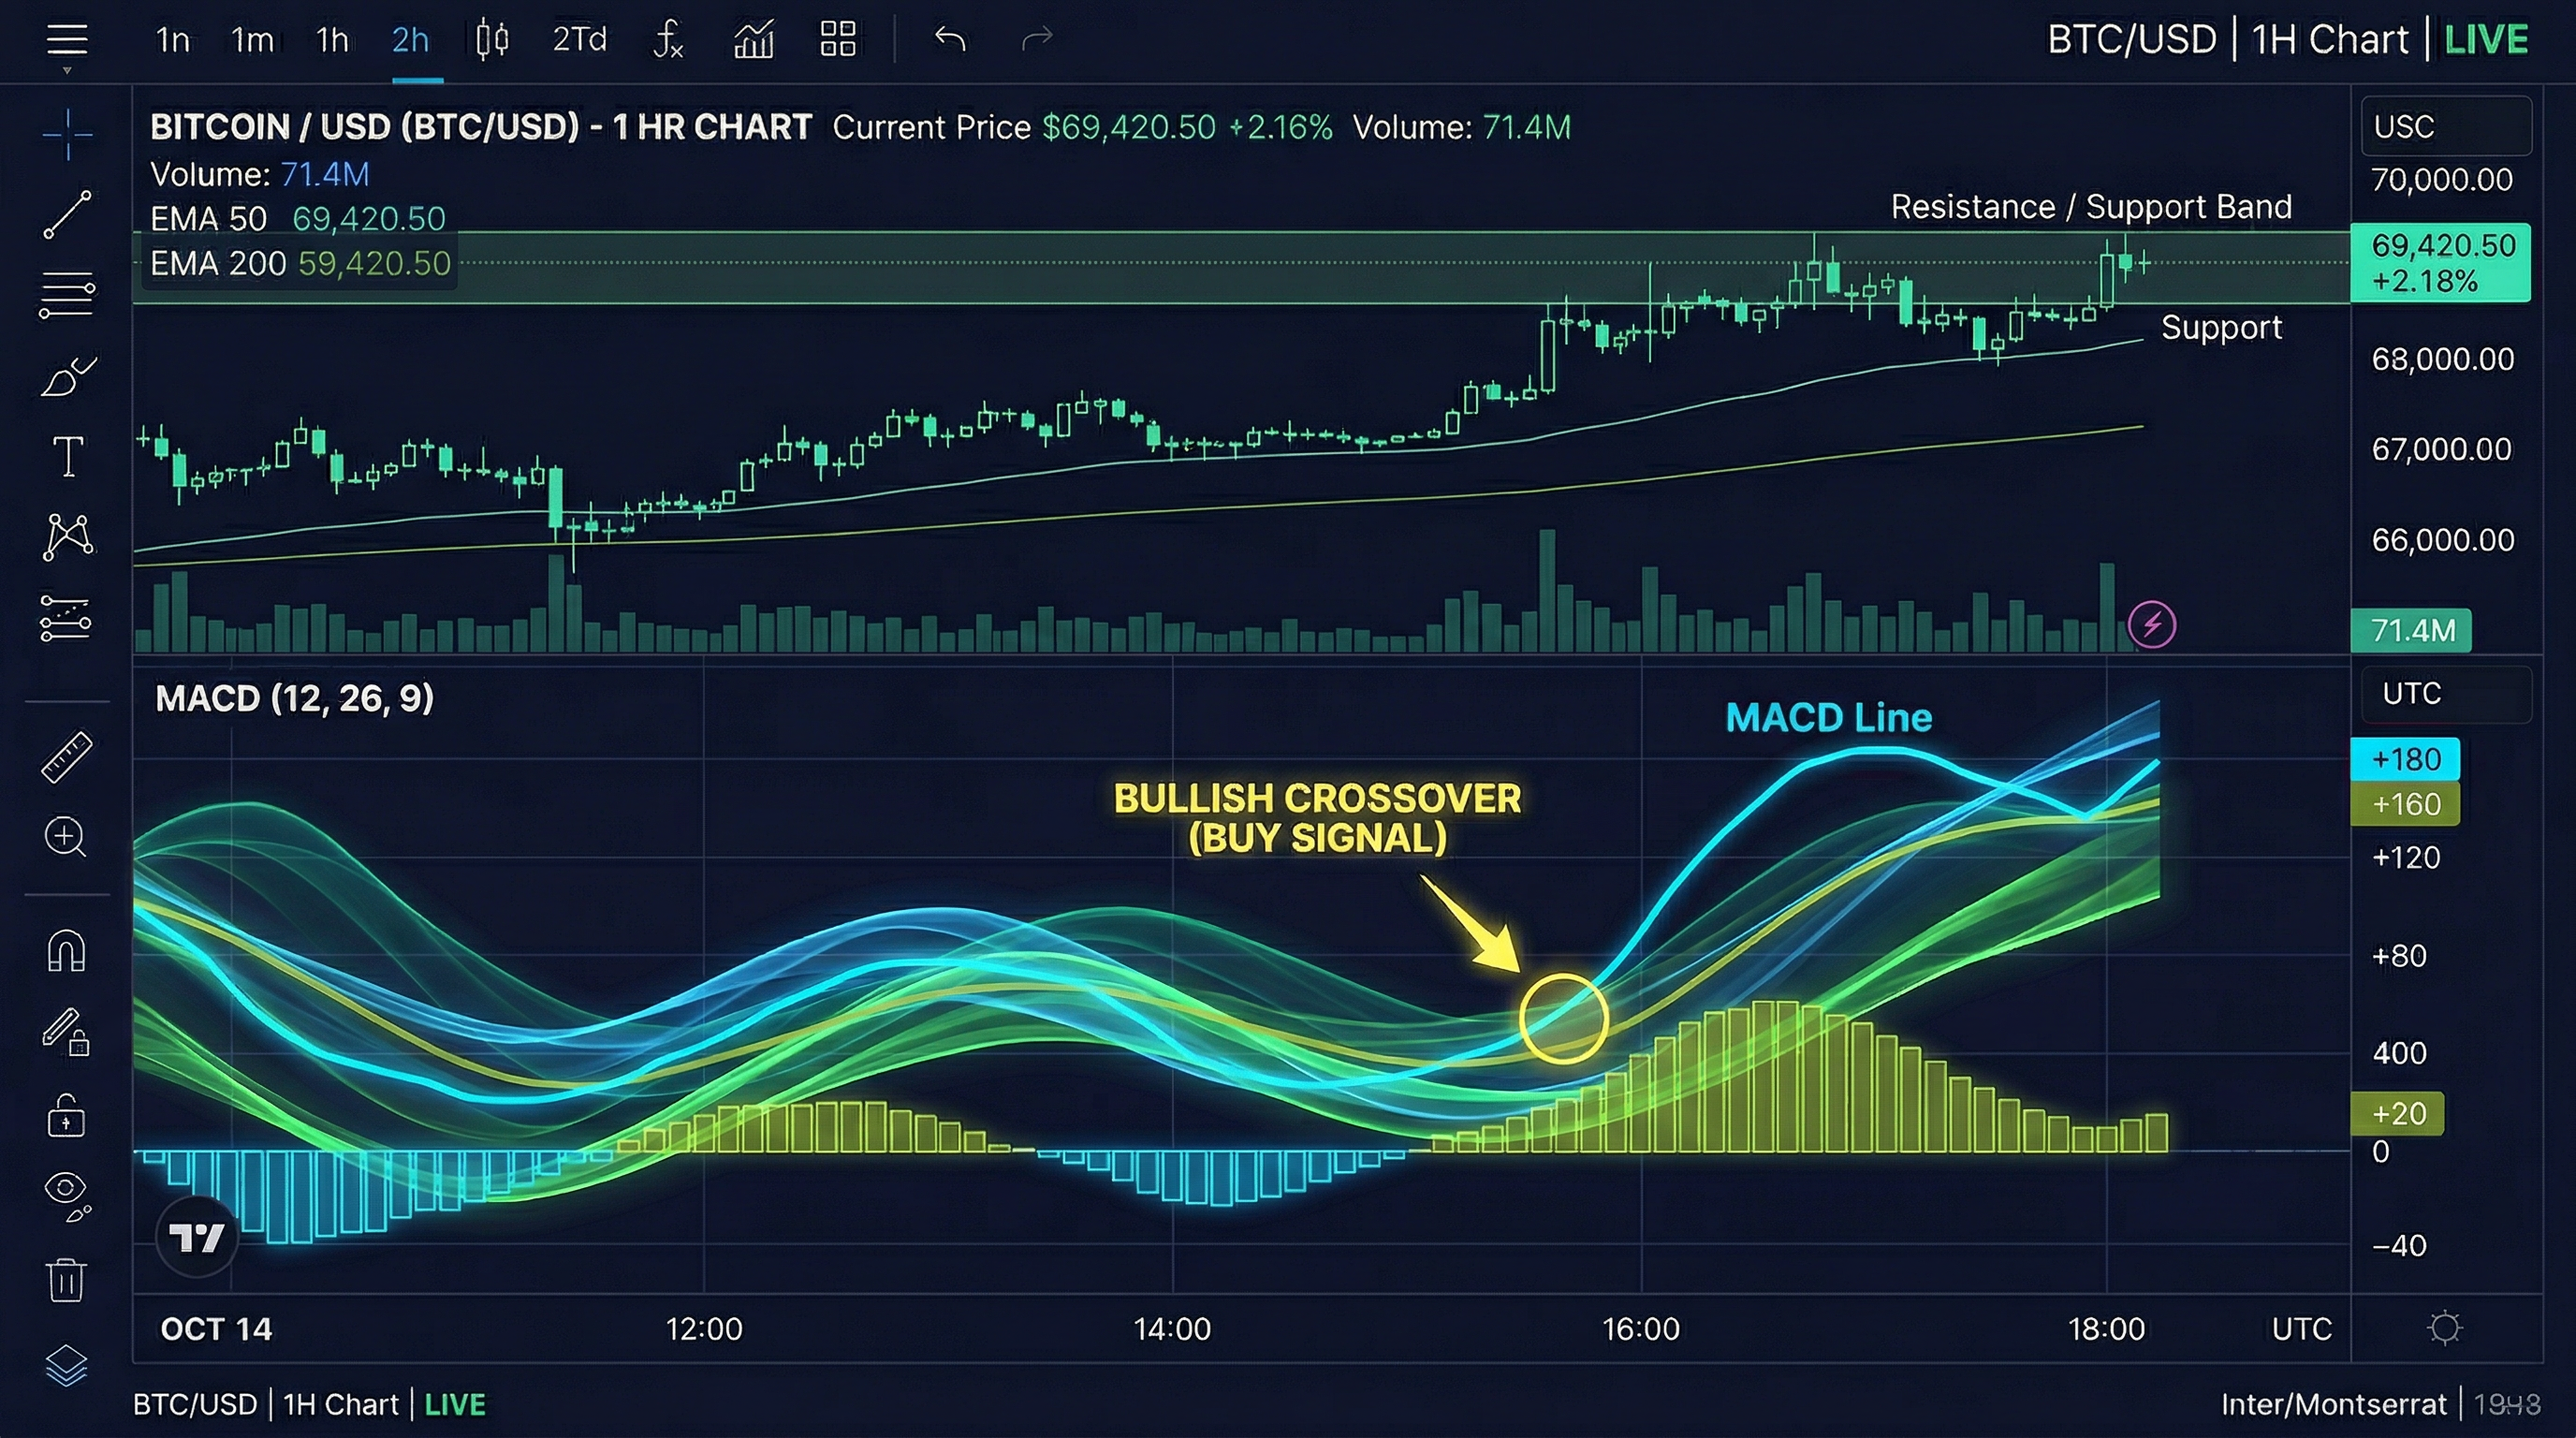
Las 3 Señales del MACD que Realmente Importan
1. El Cruce de la Línea de Señal
La señal más común del MACD: cuando la línea MACD cruza por encima de la línea de señal, es una señal de compra. Cuando la línea MACD cruza por debajo de la línea de señal, es una señal de venta. Estos cruces son más confiables cuando ocurren lejos de la línea cero (en territorios positivo o negativo profundos) que cuando ocurren cerca de cero.
2. Cruces de la Línea Cero
Cuando el MACD cruza por encima de cero (la EMA de 12 períodos sube por encima de la EMA de 26 períodos), confirma un cambio hacia momentum alcista. Por debajo de cero confirma momentum bajista. Los cruces de la línea cero son señales de tendencia más lentas y más confiables que los cruces de la línea de señal, pero son rezagados por más tiempo.
3. Divergencia del MACD
La señal más poderosa del MACD: la divergencia. Divergencia alcista ocurre cuando el precio hace un nuevo mínimo pero el MACD hace un mínimo más alto. El momentum subyacente se está mejorando incluso mientras el precio cae — frecuentemente precede a una reversión alcista. Divergencia bajista es lo opuesto: el precio alcanza nuevos máximos pero el MACD alcanza máximos más bajos — momentum debilitándose, frecuentemente precede a una caída.
El MACD es un indicador rezagado — siempre está confirmando lo que el precio ya ha hecho, no prediciendo el futuro. Úsalo para confirmar tendencias y detectar divergencias, no como señal primaria por sí solo. Combina las señales del MACD con análisis de precio y volumen para mejores resultados. Practica la lectura del MACD en gráficos reales usando la plataforma Traderise.
Leyendo el Histograma del MACD
El histograma es la parte más visualmente intuitiva del MACD. Las barras por encima de cero muestran cuánto está la línea MACD por encima de la línea de señal (momentum alcista). Las barras por debajo de cero muestran lo contrario (momentum bajista). Lo importante no es el tamaño absoluto de las barras — es si están creciendo o encogiendo:
- Barras del histograma creciendo hacia arriba: El momentum alcista está acelerando
- Barras del histograma encogiendo hacia la línea cero: El momentum alcista está desacelerando — posible cambio en camino
- Barras del histograma creciendo hacia abajo: El momentum bajista está acelerando
- Barras del histograma encogiendo desde abajo: El momentum bajista está disminuyendo
Practica Esta Estrategia Sin Riesgo
Traderise te permite operar en paper trading con $10,000 en fondos virtuales usando datos reales del mercado. Prueba cada estrategia de este artículo antes de arriesgar un solo dólar real.
Empieza a Operar en Paper Trading GratisMACD en Diferentes Marcos Temporales
El MACD se comporta de manera diferente en diferentes marcos temporales — y combinarlos puede darte señales más poderosas.
En un gráfico semanal, los cruces del MACD son señales de tendencia importantes que raramente ocurren y a menudo señalan movimientos multi-mes. En un gráfico diario, el MACD funciona bien para swing trades de varios días a varias semanas. En gráficos intradía, el MACD genera más señales pero muchas más falsas — requiere confirmación adicional.
Un enfoque poderoso: solo toma señales de compra en el MACD diario cuando el MACD semanal también está en territorio positivo. Esta confirmación de múltiples marcos temporales reduce las señales falsas dramáticamente.
Combinando el MACD con Otros Indicadores
El MACD es más poderoso combinado con otros indicadores:
MACD + RSI: Cuando ambos muestran momentum alcista simultáneamente, la señal es más fuerte. Cuando divergen (MACD alcista pero RSI sobrecomprado), ten cuidado con el riesgo de reversión.
MACD + Medias Móviles: Opera señales de compra del MACD solo cuando el precio está por encima de la MA de 200 días (tendencia de largo plazo es alcista). Esto filtra muchas señales falsas en mercados bajistas.
MACD + Soporte/Resistencia: Cuando el MACD genera una señal de compra exactamente en un nivel de soporte significativo, la convicción de la operación aumenta dramáticamente. Dos sistemas independientes señalando la misma conclusión es una combinación poderosa. Prueba estas combinaciones con el paper trading de Traderise.
Domina el MACD en Gráficos Reales
Practica la lectura de señales del MACD, divergencias e histogramas en acciones reales con las herramientas de gráficos de Traderise. Construye intuición para cuándo las señales del MACD son de alta probabilidad — antes de arriesgar capital real.
Prueba Traderise Gratis