إذا كنت تتساءل لماذا ترتفع بعض القطاعات بينما تتراجع أخرى في الوقت ذاته، فأنت تلاحظ ظاهرة تدوير القطاعات (Sector Rotation)—وهي من أقوى الأدوات التي يستخدمها المستثمرون المحترفون.
ما هو تدوير القطاعات؟
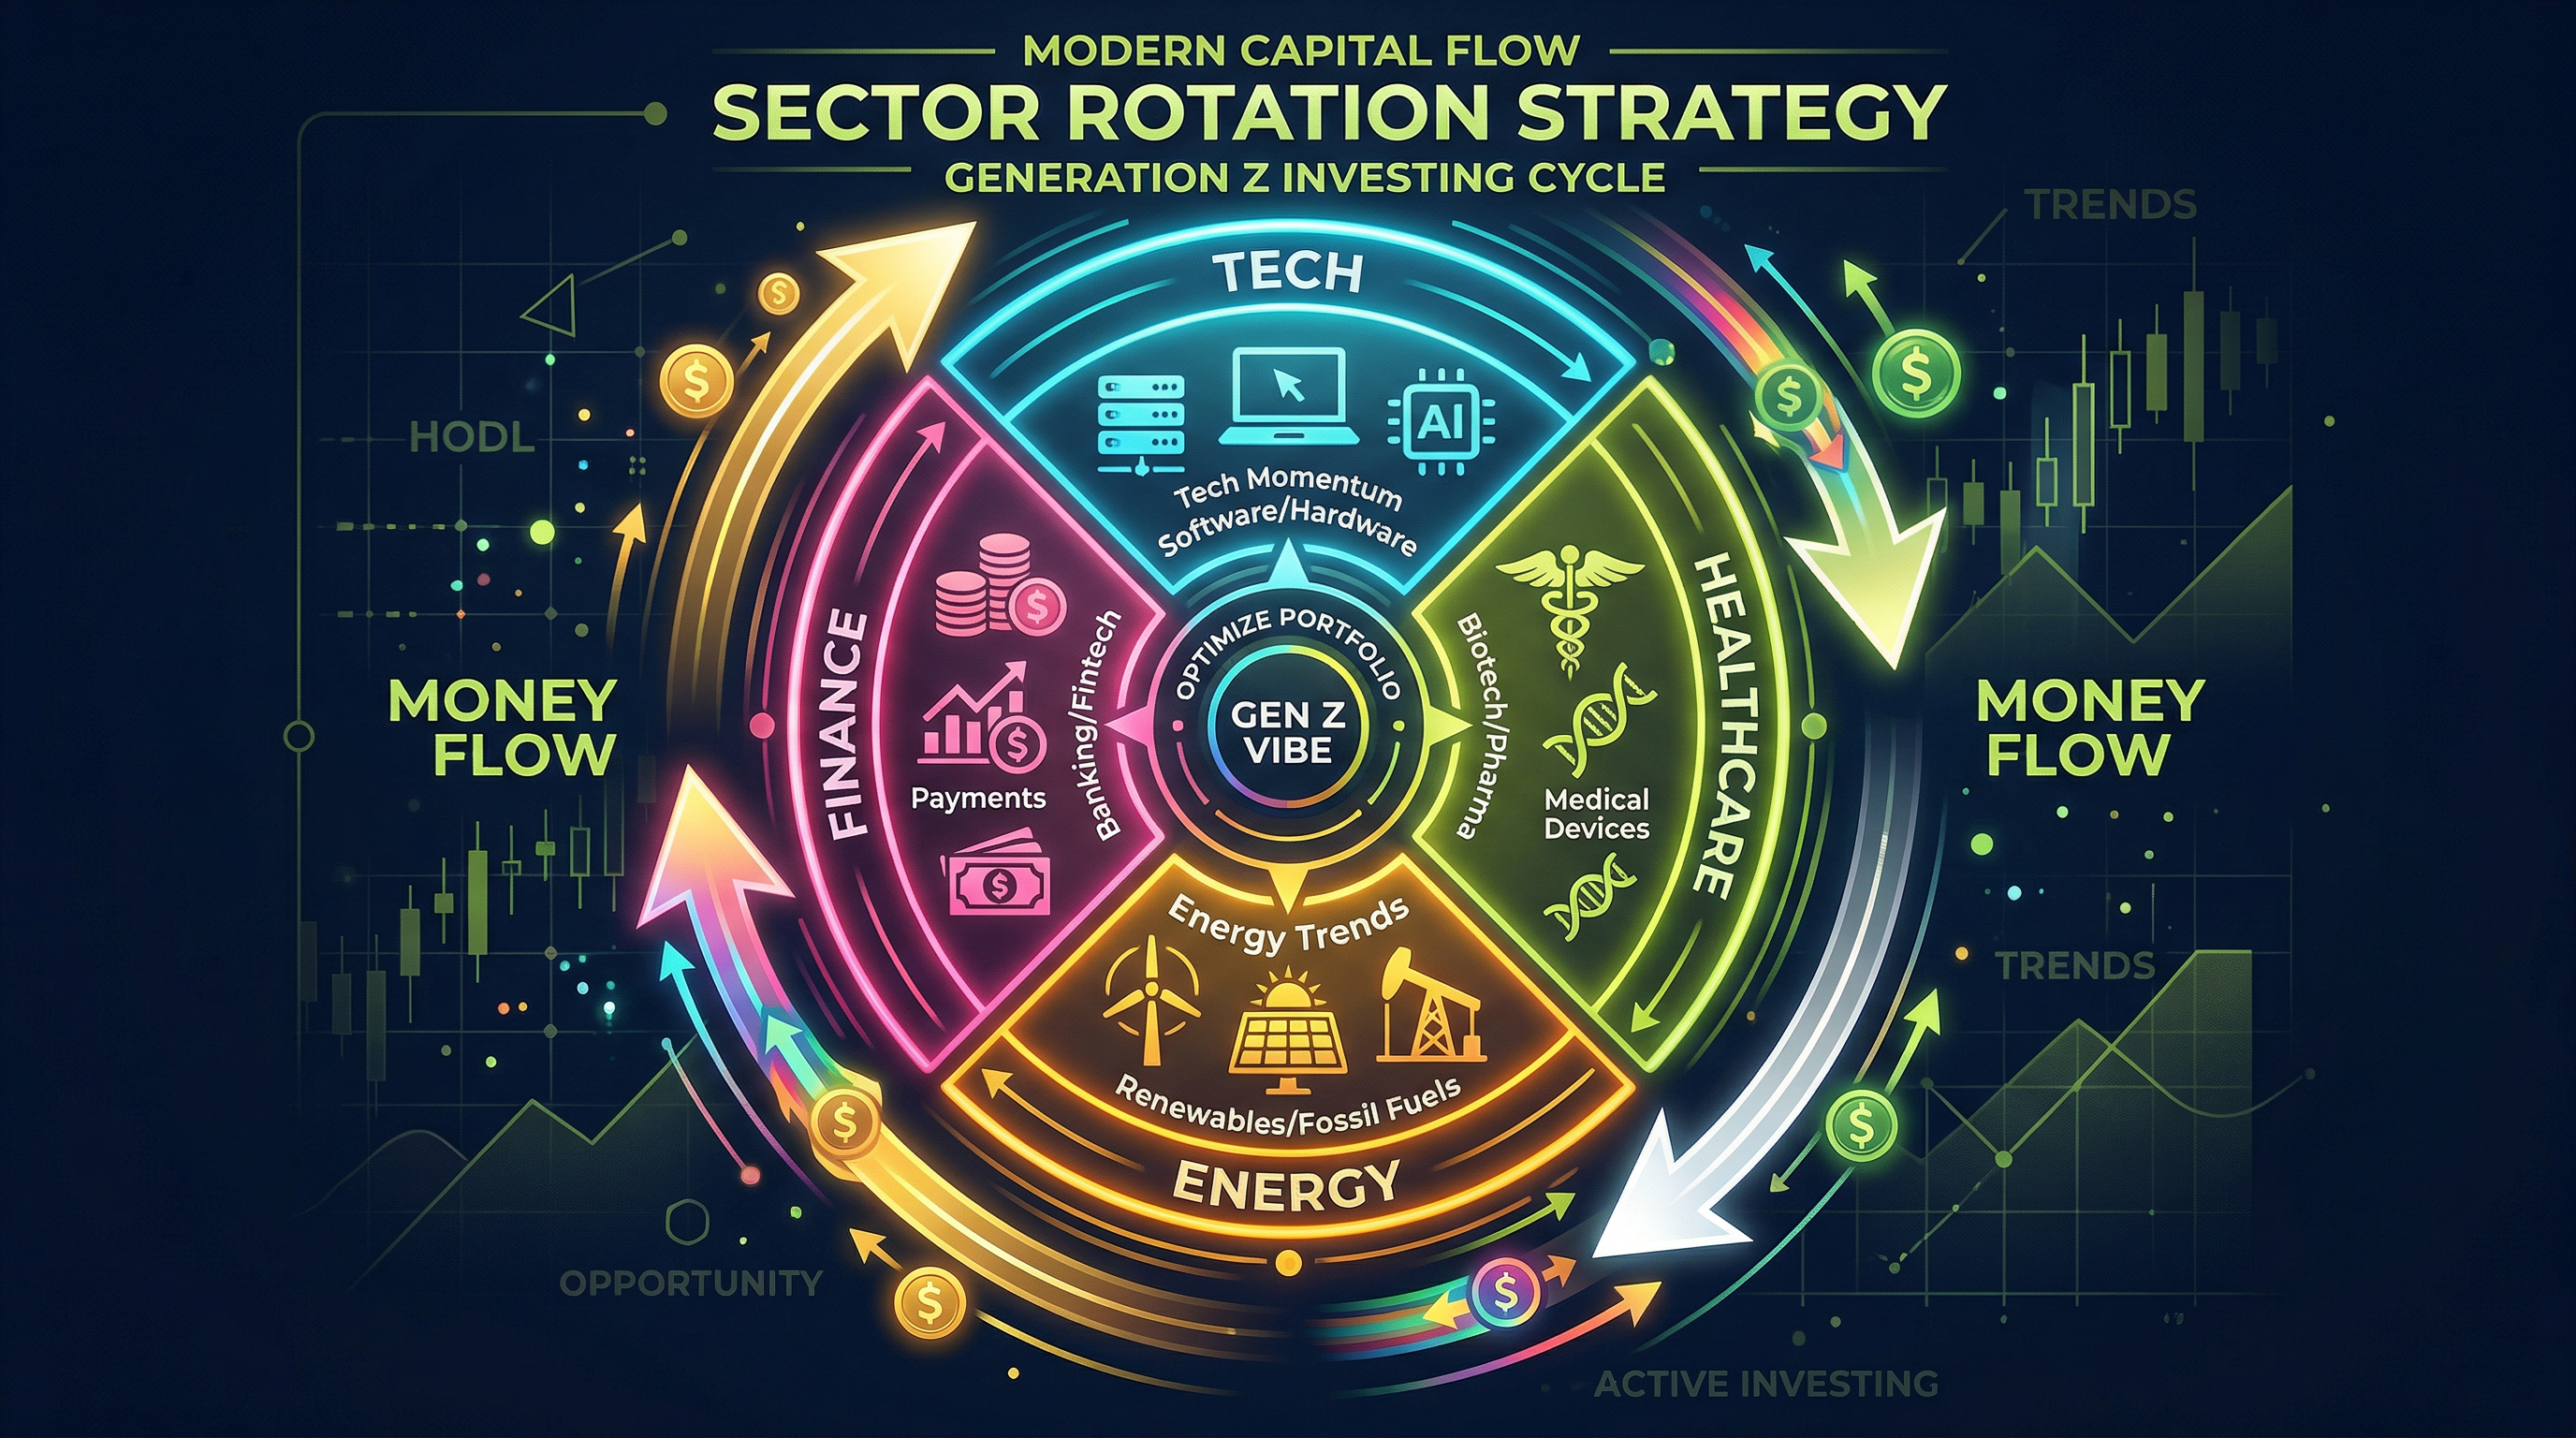
تدوير القطاعات هو تحويل رأس المال بصورة منهجية من قطاع اقتصادي إلى آخر مع تطور دورة الاقتصاد. المال الذكي (المؤسسات الكبيرة) يسبق في العادة التحولات الاقتصادية بأشهر.
القطاعات ودورة الاقتصاد
مراحل الدورة الاقتصادية الأربع وقطاعاتها المفضلة:
- التوسع المبكر: التكنولوجيا (XLK)، التقديرية الاستهلاكية (XLY)، المالية (XLF)
- التوسع المتأخر: الطاقة (XLE)، المواد (XLB)، الصناعات (XLI)
- الانكماش: الرعاية الصحية، السلع الاستهلاكية الأساسية (XLP)، المرافق (XLU)
- الانتعاش: المالية، التكنولوجيا
كيف تتابع تدوير القطاعات؟
أبسط طريقة: قارن أداء ETF القطاعية مقارنةً بـ SPY على مدار الشهر الماضي.
- القطاعات المتفوقة على SPY تستقطب تدفقات الأموال.
- القطاعات المتخلفة عن SPY تشهد خروج الأموال منها.
المراقبة الأسبوعية لهذه النسب النسبية تكشف اتجاهات التدوير قبل أن تظهر في الأخبار.
اركب الموجة، لا تعارضها. الانتقاء الفردي للأسهم في قطاع يفقد التدفقات المؤسسية أصعب بكثير من ركوب قطاع يستقبل هذه التدفقات. حدد الاتجاه أولاً، ثم ابحث عن الأسهم.
التطبيق العملي
- تابع ETF القطاعية الرئيسية: XLK، XLF، XLY، XLP، XLE، XLI، XLC، XLU، XLB، XLRE، XLV.
- احسب أداء كل منها مقارنةً بـ SPY على مدى 4 أسابيع.
- أضف القطاعات المتفوقة إلى قائمة مراقبتك للبحث عن أسهم محددة.
- أعد التقييم أسبوعياً.
هل أنت مستعد لتطوير تداولك؟
تدرّب على تحليل القطاعات وبناء محفظتك على Traderise بأموال افتراضية.
جرّب Traderise مجاناً