Charts show you history. Level 2 data shows you the present — the live battle between buyers and sellers happening right now, millisecond by millisecond. When I first looked at Level 2, it was like someone turned on the lights in a dark room. Everything I'd been reading from charts was a delayed summary of what Level 2 was showing in real time.
This is one of the most underexplored areas of beginner trading education. Here's the complete, plain-English guide.
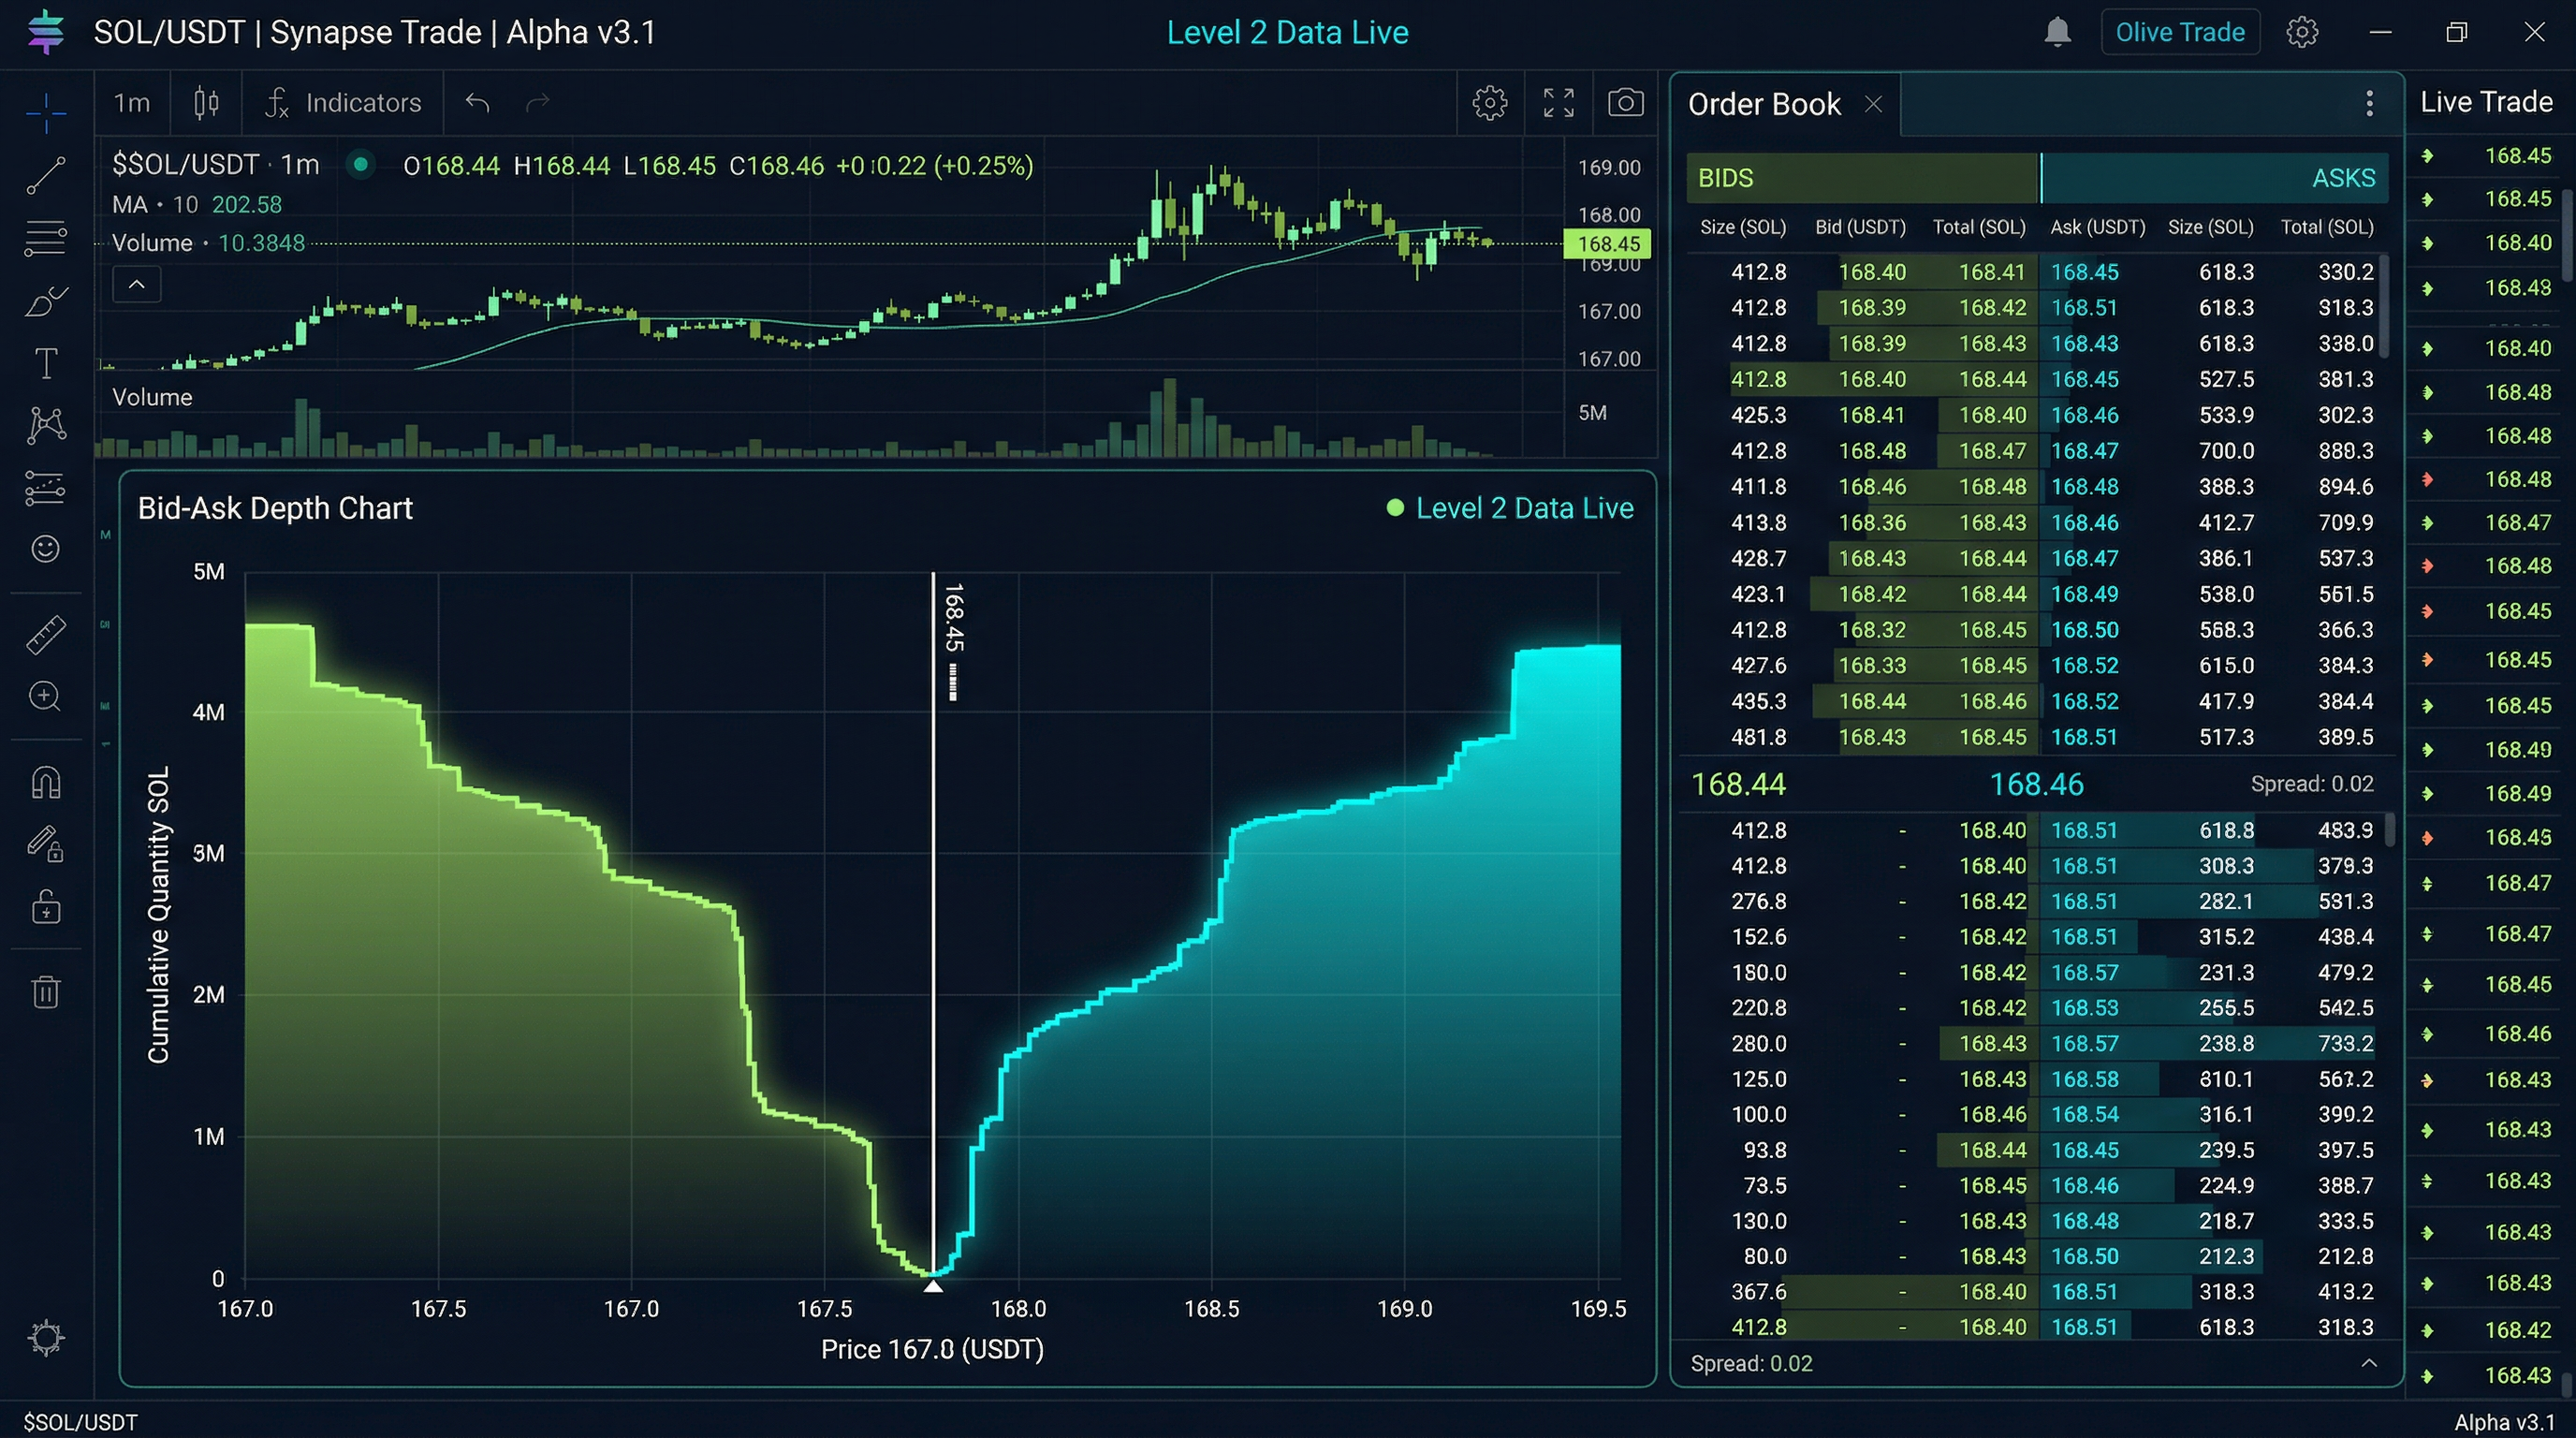
What Is Level 2 Data?
Regular stock quotes (Level 1) show you the current bid price (highest price a buyer will pay), ask price (lowest price a seller will accept), and the last traded price. Level 2 goes deeper: it shows you the depth of the market — all the pending buy orders (bids) at various prices below the market and all the pending sell orders (asks/offers) above it.
This is called the order book, and it gives you a live window into supply and demand at specific price levels.
The Basic Structure of Level 2
Level 2 is displayed as two columns: the bid side (buyers) on the left and the ask side (sellers) on the right. Each row shows: market maker or exchange ID, price, and number of shares at that price.
Example: You see 5,000 shares sitting at the ask price of $50.25 from a market maker. That's 5,000 shares of supply you need to absorb before price can move above $50.25. If there's 100,000 shares of buying demand flooding in at the market, that 5,000 shares disappears instantly and price moves up. If demand is thin, price stalls at that level or pulls back.
Key Level 2 Concepts Every Beginner Should Know
Bid-Ask Spread
The difference between the best bid and best ask is the spread. Narrow spread (like $0.01 on a liquid stock) = competitive, efficient market, low transaction cost. Wide spread (like $0.50 on a thinly traded stock) = illiquid, expensive to trade — every round trip costs you the spread twice.
For beginners: avoid stocks with spreads wider than $0.10. The transaction cost alone will drag down your results on small accounts. Focus on liquid stocks where Traderise and other platforms can get you tight spreads.
Market Makers vs. ECNs
Level 2 identifies who is posting orders. Market makers (firms like Citadel, Virtu) are required to post bids and asks to provide liquidity. ECNs (Electronic Communication Networks like ARCA, BATS) are where most retail and institutional orders are routed. Seeing large orders from ECNs (especially ARCA) often signals real institutional activity more than market maker quotes.
Size Matters
Not all Level 2 quotes are equal. 100 shares at $50.25 is noise. 50,000 shares at $50.25 is a wall of supply. Large orders at specific price levels often act as invisible resistance or support — price struggles to move through big orders without either a surge in demand to absorb them or those orders being pulled.
Level 2 is most useful for timing entries and exits on stocks you've already identified through chart analysis. It refines your execution, not your stock selection. Start by just watching Level 2 on a stock during the open for 30 minutes without trading — you'll quickly develop intuition for what "strong buying" vs. "thin, suspicious price action" looks like. Practice this safely with Traderise's paper trading tools.
Reading Order Flow: Beyond the Static Order Book
Order flow takes Level 2 analysis to the next level. Instead of just looking at pending orders, you're analyzing the actual flow of executed trades — who's buying, who's selling, how aggressively.
Market Orders vs. Limit Orders in Context
When someone is aggressive about wanting into a position right now, they use market orders — they'll buy at whatever the current ask is. These market buy orders "lift the ask" and push prices up. Conversely, urgent selling hits the bid and pushes prices down. Aggressive market orders signal urgency and conviction; passive limit orders signal patience.
When you see a surge of market orders hitting the ask — many consecutive trades at the ask price — buyers are urgently accumulating. Price almost always rises shortly after a sustained period of ask-side aggression.
The Tape: Time and Sales
The time and sales (the "tape") is a running list of every executed trade: time, price, and size. Reading the tape gives you order flow data in real time. Key patterns to recognize:
- Large prints at the ask repeatedly: Strong buying, price likely to continue rising
- Large prints at the bid repeatedly: Strong selling, price likely to continue falling
- Alternating small prints above and below midpoint: Indecision, choppy conditions, stay out
Practice This Strategy Risk-Free
Traderise lets you paper trade with $10,000 in virtual funds using real market data. Test every strategy in this article before you risk a single real dollar.
Start Paper Trading FreePractical Order Flow Setups for Beginners
The Stacked Bid Setup
You see multiple large bids piling up at the same level on Level 2 — significantly more buying interest than usual concentrated at a specific price. This "stacked bid" suggests either genuine institutional accumulation at a level they consider attractive, or a market maker supporting the price. Either way, it's a bullish signal when combined with upward price action.
The Wall Being Absorbed
A 100,000-share offer (ask) sits at $55, blocking price from moving higher. But the tape shows steady buying — the ask keeps getting hit, and the share size slowly dwindles. 100,000... 80,000... 60,000... When the wall is nearly absorbed, price is about to break above $55 with potentially explosive momentum. This is one of the most reliable intraday setups for day traders.
The Bid Pull (Warning Sign)
You see large bids supporting price on Level 2. Suddenly, those bids disappear — they're "pulled." Price often drops quickly because the support everyone was counting on just evaporated. Bid pulls are a warning that the perceived support wasn't genuine long-term buying interest but rather short-term positioning.
Should Beginners Use Level 2?
Honest answer: not as your primary tool. Level 2 and order flow are advanced inputs that require a lot of context to interpret correctly. A beginner trying to trade purely from Level 2 without strong chart analysis fundamentals will get confused by normal market noise.
The right sequence: first, master chart analysis (support/resistance, trend identification, volume analysis). Then, add Level 2 as an execution enhancer — using it to time your entries more precisely once you've already identified the trade through chart analysis.
Start by just watching Level 2 on liquid stocks like Apple or SPY during Traderise's paper trading sessions for educational observation, without trading from it. Pattern recognition develops over time, and the observation period is invaluable.
Learn to Read Real Market Order Flow
Traderise gives you access to real market data so you can practice reading bid-ask spreads, volume patterns, and order flow — all in a paper trading environment where mistakes don't cost you money.
Try Traderise Free